A dashboard-in-the-terminal for a bike sensor.
Context
I'd rather be running and/or outside but an injury earlier this year led me to spend more time of late on a turbo trainer (this is basically a metal frame that holds a bike's back wheel while you cycle in place with some magnetic resistance) instead.
To keep track of how much work is being done while on the turbo, I got a coin-sized box with no display that attaches to bike's crank shaft or back wheel called a cadence sensor. There are many cheap sensor devices that use Bluetooth Low Energy (BLE) or the proprietary ANT protocol.
This kind of sensor is super simple. It keeps track of how many revolutions the wheel/crank has made and how many seconds have passed since the thing last switched on and broadcasts those two numbers (along with some headers) to whatever BLE/ANT transciever they've connected to each time it detects another revolution.
Unfortunately at the time of writing the available Android apps that talk to these sensors seemed to exclusively be some combination of stuffed with irrelevant ads, sketchy as fuck from a data-gathering/tracking perspective or just didn't work at all.
At the same time, I was looking for an excuse to build a terminal-user-interface (TUI) with the rich library to try it out (as opposed to the python-prompt-toolkit library that I would usually reach for).
cycling-cadence-display
So I did the (completely un)needful and wrote a TUI dashboard of info about the bike sensor showing things like how long it's been on, the instantaneous/mean revoluitions per minute (RPM). It also renders a plot of the RPM over time in ascii (via gnuplot) and trivially let's you export all the time-series data locally.
When cycling it looks like the gif above. Usually I've got a small, semi-transparent terminal-app window with this running and some TV/film thing on in the background of a wall-mounted screen just in front of the bike which is slightly more interesting than starting at the wall behind it.
Of course for using it on a phone instead you can termux which looks like this:
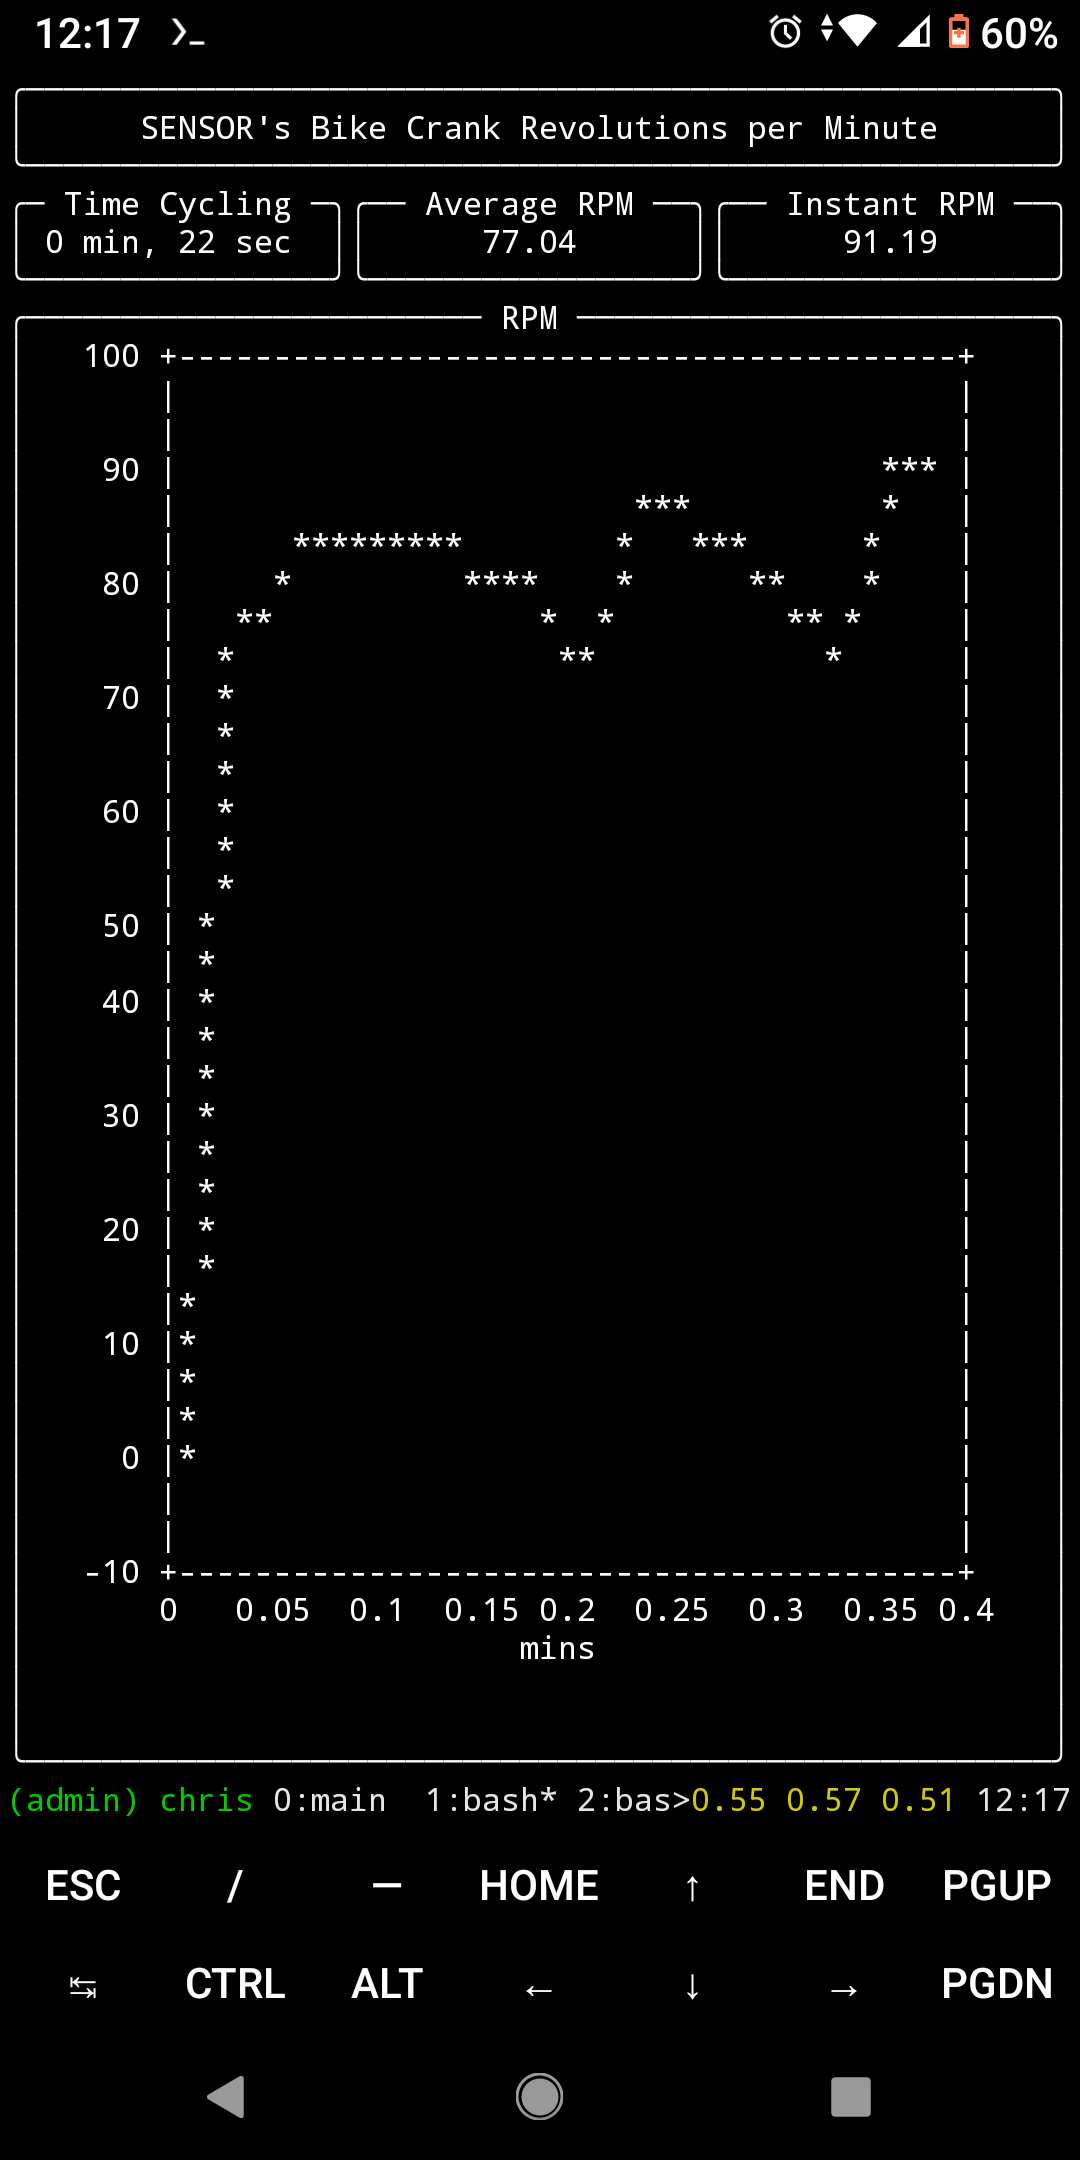
(As an aside, termux and it's API are a marvel for turning an Android phone into something much more useful with bash, cron, ssh, apt, access to storage/contacts etc.).
Conclusion
Overall I found the rich library intuitive to use and well documented - im my opinion it is ready to be used at work/in production to display a dashboard of information. It's not really built to for interactive interfaces though, for that you're really looking to use textual instead which is a for-profit org (who also happen to have written the rich library for use in textual).
Personally I found myself doing longer "cycles" on the bike more often since I started using the dashboard. Ironically I got over the injury not long after this project so am back to hoofing it around the local woods / thames-path most of the time but the code is on Github and available on PyPI.
Go Top